什么是Dstat ?
stat是一个功能强大,灵活多变的工具,类似于 vmstat、iostat、mpstat,所不同的是,可以监控多个系统指标,如 CPU、网络、内存、中断等,可以将结果显示到终端,也可保存到文件。另外,该程序是通过 Python 实现的。
Dstat用法:
dstat [-afv] [options..] [delay [count]]
常用选项:
-c, –cpu
统计CPU状态,包括 user, system, idle (空闲等待时间百分比), wait (等待磁盘IO),
hardware interrupt (硬件中断), software interrupt (软件中断) 等;
-d, –disk
统计磁盘读写状态,主要包括了读写信息;
-l, –load
统计系统负载情况,包括1分钟、5分钟、15分钟平均值;
-m, –mem
统计系统物理内存使用情况,包括used, buffers, cache, free;
-s, –swap
统计swap已使用和剩余量;
-n, –net
统计网络使用情况,包括接收和发送数据;
-p, –proc
统计进程信息,包括runnable、uninterruptible、new;
-N eth1,total
统计eth1接口汇总流量;
-r, –io
统计I/O请求,包括读写请求;
-y, –sys
统计系统信息,包括中断、上下文切换;
-t
显示统计时时间,对分析历史数据非常有用;
–fs
统计文件打开数和inodes数;
如何安装
在CentOS和Redhat中
yum install dstat -y
dstat不支持python3,如果你的系统中使用了python3需要修改dstat文件头部改为python2
< 11 NGINX-1 - [root]: ~ > # which dstat
/usr/bin/dstat

< 11 NGINX-1 - [root]: ~ > # vim /usr/bin/dstat
#!/usr/bin/python2.7
### This program is free software; you can redistribute it and/or modify
### it under the terms of the GNU Library General Public License as published by
### the Free Software Foundation; version 2 only
###
### This program is distributed in the hope that it will be useful,
### but WITHOUT ANY WARRANTY; without even the implied warranty of
### MERCHANTABILITY or FITNESS FOR A PARTICULAR PURPOSE. See the
### GNU Library General Public License for more details.
###
### You should have received a copy of the GNU Library General Public License
### along with this program; if not, write to the Free Software
### Foundation, Inc., 59 Temple Place - Suite 330, Boston, MA 02111-1307, USA.
### Copyright 2004-2007 Dag Wieers <dag@wieers.com>


from __future__ import generators


try:
    import sys, os, time, sched, re, getopt
    import types, resource, getpass, glob, linecache
    except KeyboardInterrupt:
pass


VERSION = '0.7.2'
theme = { 'default': '' }
if sys.version_info < (2, 2):
    sys.exit('error: Python 2.2 or later required')

### Workaround for python <= 2.2.1
dsata如果不加选项默认选项是-a或cdngy选项
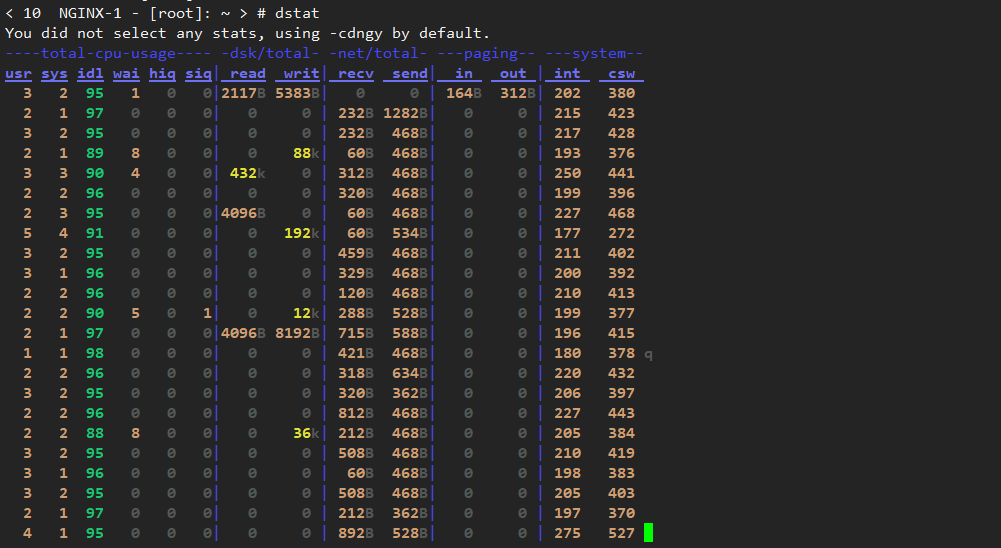
上面的输出结果:
- CPU统计数据:用户(usr)进程的CPU使用情况,系统(sys)进程,以及空闲(idl)和等待(wai)进程数,硬中断(hiq)和软中断(siq)。
- 磁盘统计信息:磁盘上的读取(读取)和写入(写入)操作的总数。
- 网络统计:网络接口上接收(recv)和发送(发送)的总字节数。
- 分页统计信息:信息被复制到内存中(内)和外出(外出)的次数。
- 系统统计信息:中断数(int)和上下文切换(csw)。
要显示提供的信息vmstat,请使用-v或--vmstat选项:

- 进程统计:运行(run),阻塞(blk)和新(new)生成进程的数量。
- 内存统计:使用(used),缓冲(buff),缓存(cach)和剩余(free)内存的数量。
Dstat进阶操作
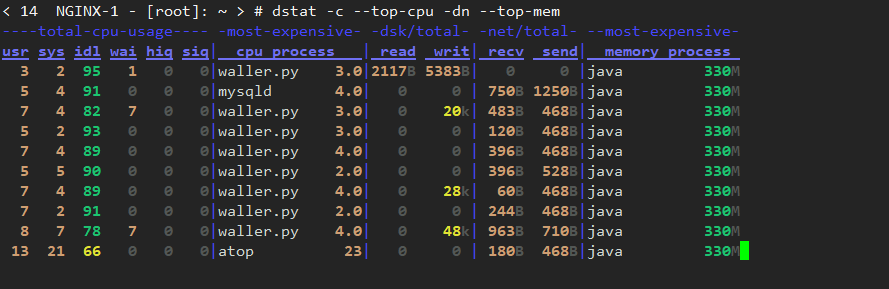
-c– CPU使用率--top-cpu– 使用大多数CPU的过程-dn– 磁盘和网络统计信息--top-mem– 消耗最多内存的进程
dstat -c --top-cpu -dn --top-mem
我们可以通过启用--output选项,将dstat的输出存储在文件中,以便在以后进行分析。
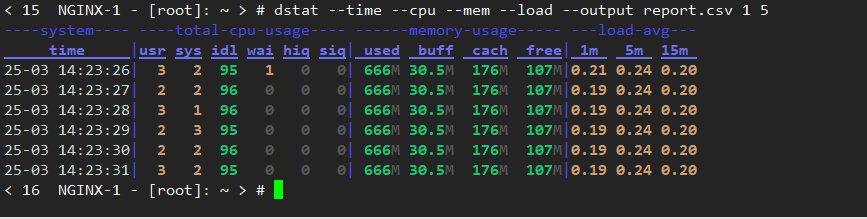
示例:显示时间,CPU,内存,系统负载统计数据,每隔1秒刷新一次,捕捉5次结果后退出dstat。
dstat --time --cpu --mem --load --output report.csv 1 5
显示每个CPU的详细信息(包括cpu0,cpu1等)和总使用情况。它显示每个CPU(用户时间,系统时间,空闲时间,和等待时间)活动进程
dstat -C 0,1,2,total
显示有关特定磁盘的磁盘利用率(读取和写入)和磁盘I / O(读取和写入)利用率的详细信息。如果要检查总磁盘利用率和I / O,请使用dstat --disk --io。

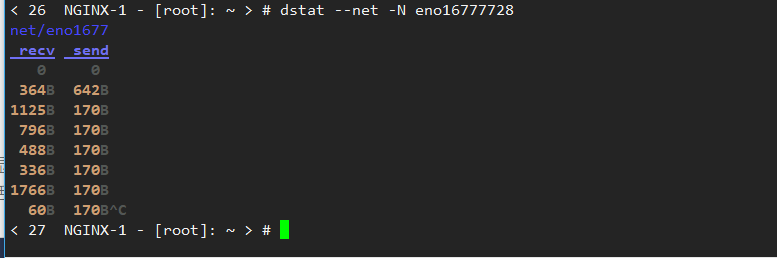
显示特定网络利用率(数据接收和数据发送)的详细信息。如果要显示所有以太网利用率,请使用dstat --net。
dstat --net -N eno16777728
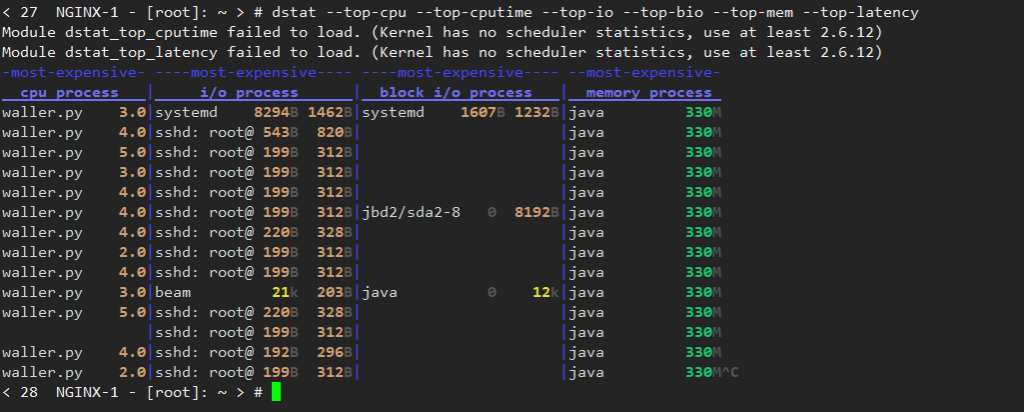
显示有关top cpu,top cputime(使用最多CPU时间(以ms为单位)的进程),top磁盘I / O活动,top磁盘块I / O活动,top memory和top latency usage的详细信息。
dstat --top-cpu --top-cputime --top-io --top-bio --top-mem --top-latency
显示有关(CPU,磁盘,内存,进程,负载和网络)使用情况的详细信息,这对于服务器负载过高时的基本故障排除非常常见。
dstat --cpu --mem --proc --load --disk --net

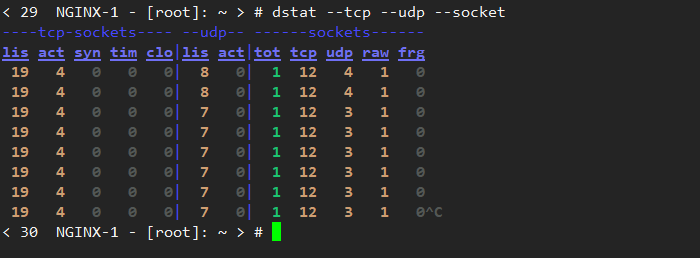
显示网络有关tcp(listen,established,syn,time_wait,close),udp(listen,active)和socket(total,tcp,udp,raw,ip-fragments)用法的详细信息。
dstat --tcp --udp --socket